QML
← All components

Sparkline Chart

Show a compact chart beside a number or inside a table to make a trend easy to scan.

import Syidax.Core.SparklineChart

Supported QML types

TypeDefinition / role
Small inline chart for trends, comparisons or proportions.

Learn by example

Previews are images of native Qt runs. Use the buttons below each image to view a result.

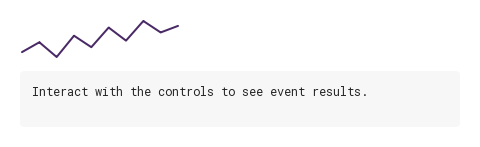
01 Basic composition

A compact chart for numeric or OHLC values.

Qt capture · image
Basic composition · Default
Default execution
QML code
import QtQuick
import Syidax.Core

Item {
    component EventLog: Rectangle {
        id: logBox
        property var lines: []
        implicitWidth: 440
        implicitHeight: Math.max(56, logText.implicitHeight + 24)
        radius: 4; color: Theme.semantic.backgroundBold
        function log(value) { lines = lines.slice(-3).concat([String(value)]) }
        Text {
            id: logText; x: 12; y: 12; width: parent.width - 24
            text: logBox.lines.length ? logBox.lines.join("\n") : "Interact with the controls to see event results."
            wrapMode: Text.Wrap; color: Theme.semantic.textDefault
            font.family: Theme.monoFontFamily; font.pixelSize: 12
        }
    }

    implicitWidth: Math.max(360, childrenRect.width)
    implicitHeight: childrenRect.height
    id: story

    readonly property alias chartControl: trend
    property int tick: 0
    readonly property var numbers: [12, 18, 9, 22, 15, 27, 19, 31, 24, 28]
    readonly property var candles: [[10, 14, 9, 13], [13, 15, 11, 12], [12, 16, 12, 15], [15, 15, 10, 11], [11, 14, 10, 14], [14, 18, 13, 17]]
    property QtObject settings: QtObject {
        id: storyArgs
        property string type: "line"
        property string values: ""
        property int width: 160
        property int height: 40
        property string min: ""
        property string max: ""
        property bool smooth: false
        property bool showPoints: false
        property bool showValue: false
        property string textPosition: "top"
        property bool interactive: true
        property string label: "Sparkline chart"
        property string emptyText: "No data"
        property string formatter: "default"
        property string color: ""
        property string fontColor: "#000000"
        property string fontSize: ""
        property string referenceLine: ""
        property real thickness: 2
        property string stockColorScheme: "us"
        property bool stream: false
        property bool animated: true
        property int streamDuration: 1000
        property bool showTooltip: true
    }

    function initialValues() { return storyArgs.values.length ? storyArgs.values : (storyArgs.type === "stock" ? story.candles : story.numbers) }

    function pushValue() {
        story.tick += 1
        const next = Math.round(22 + Math.sin(story.tick * 0.7) * 10)
        if (storyArgs.type === "stock") {
            const current = trend.getValues()
            const open = current.length ? current[current.length - 1].close : 20
            trend.addValue({ open: open, high: Math.max(open, next) + 2, low: Math.min(open, next) - 2, close: next })
        } else trend.addValue(next)
    }

    Connections {
        target: storyArgs

        
    }
    Timer { interval: 500; running: storyArgs.stream; repeat: true; onTriggered: story.pushValue() }
    Column {
        spacing: 12
        Item {
            width: trend.width; height: trend.height + 28
            SySparklineChart {
                id: trend
                y: 28
                width: Math.max(20, storyArgs.width); height: Math.max(20, storyArgs.height)
                type: storyArgs.type
                min: storyArgs.min.trim().length ? Number(storyArgs.min) : Number.NaN
                max: storyArgs.max.trim().length ? Number(storyArgs.max) : Number.NaN
                smooth: storyArgs.smooth; showPoints: storyArgs.showPoints; showValue: storyArgs.showValue
                textPosition: storyArgs.textPosition; interactive: storyArgs.interactive
                label: storyArgs.label; emptyText: storyArgs.emptyText
                formatter: storyArgs.formatter === "default" ? null : (value) => storyArgs.formatter === "fixed2" ? value.toFixed(2) : value.toFixed(1) + "%"
                color: storyArgs.color; fontColor: storyArgs.fontColor; fontSize: storyArgs.fontSize
                referenceLine: storyArgs.referenceLine; thickness: storyArgs.thickness
                stockColorScheme: storyArgs.stockColorScheme
                stream: storyArgs.stream; animated: storyArgs.animated; streamDuration: storyArgs.streamDuration
                showTooltip: storyArgs.showTooltip
                values: story.initialValues()
                onPointSelected: (detail) => output.log(detail.value)
            }
        }
        EventLog { id: output }
    }

}

02 type

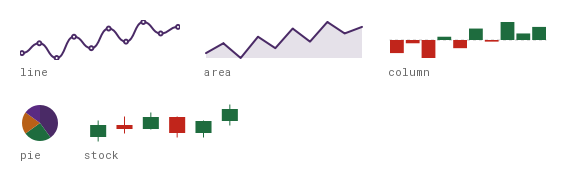
The five types, each a different drawing of the same values:

Qt capture · image
type · Default
Default execution
QML code
import QtQuick
import Syidax.Core

Item {
    implicitWidth: Math.max(360, childrenRect.width)
    implicitHeight: childrenRect.height
    id: story
    readonly property var numbers: [12, 18, 9, 22, 15, 27, 19, 31, 24, 28]
    readonly property var candles: [[10, 14, 9, 13], [13, 15, 11, 12], [12, 16, 12, 15], [15, 15, 10, 11], [11, 14, 10, 14], [14, 18, 13, 17]]

    Flow {
        width: 560
        spacing: 24
        Column { spacing: 4; SySparklineChart { type: "line"; curved: true; showPoints: true; values: story.numbers } Text { text: "line"; font.family: Theme.monoFontFamily; font.pixelSize: 11; color: Theme.semantic.textSubtle } }
        Column { spacing: 4; SySparklineChart { type: "area"; values: story.numbers } Text { text: "area"; font.family: Theme.monoFontFamily; font.pixelSize: 11; color: Theme.semantic.textSubtle } }
        Column { spacing: 4; SySparklineChart { type: "column"; referenceLine: "20"; values: story.numbers } Text { text: "column"; font.family: Theme.monoFontFamily; font.pixelSize: 11; color: Theme.semantic.textSubtle } }
        Column { spacing: 4; SySparklineChart { type: "pie"; width: 40; height: 40; values: [40, 25, 20, 15] } Text { text: "pie"; font.family: Theme.monoFontFamily; font.pixelSize: 11; color: Theme.semantic.textSubtle } }
        Column { spacing: 4; SySparklineChart { type: "stock"; values: story.candles } Text { text: "stock"; font.family: Theme.monoFontFamily; font.pixelSize: 11; color: Theme.semantic.textSubtle } }
    }
}

03 stream · animated · streamDuration

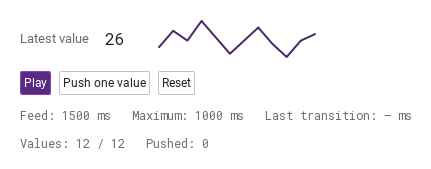
A compact 160 × 40 px sparkline beside the latest value.

Qt capture · image
stream · animated · streamDuration · Default
QML code
import QtQuick
import Syidax.Core

Item {
    implicitWidth: Math.max(360, childrenRect.width)
    implicitHeight: childrenRect.height
    // Focused Gallery routes: keep only the selected API and its prerequisites.

    id: story
    readonly property alias chartControl: feed
    readonly property alias feedTimer: timer
    property bool playing: false
    property int tick: 0
    property QtObject settings: QtObject {
        id: storyArgs
        property string type: "line"
        property bool stream: true
        property bool animated: true
        property int streamDuration: 1000
        property int timeInterval: 1500
        property alias interval: storyArgs.timeInterval
        property bool smooth: false
        property bool showPoints: false
        property bool showValue: false
        property string stockColorScheme: "us"
    }

    function seed() {
        const values = [22, 27, 24, 30, 25, 20, 24, 28, 23, 19, 24, 26]
        return storyArgs.type === "stock" ? values.map((close, i) => {
            const open = i > 0 ? values[i - 1] : 20
            return { open: open, high: Math.max(open, close) + 2, low: Math.min(open, close) - 2, close: close }
        }) : values
    }
    function resetFeed() { story.tick = 0; feed.values = story.seed(); feed.activeIndex = -1 }
    function pushValue() {
        story.tick += 1
        const close = Math.round(24 + Math.sin(story.tick * 0.65) * 8 + Math.cos(story.tick * 0.3) * 3)
        const values = feed.getValues()
        if (storyArgs.type === "stock") {
            const open = values.length ? values[values.length - 1].close : 24
            feed.addValue({ open: open, high: Math.max(open, close) + 2, low: Math.min(open, close) - 2, close: close })
        } else feed.addValue(close)
    }
    Connections { target: storyArgs;   }
    Timer {
        id: timer
        interval: Math.max(16, storyArgs.timeInterval)
        running: story.playing
        repeat: true
        onTriggered: story.pushValue()
    }

    Column {
        spacing: 12
        Row {
            spacing: 16
            Text {
                anchors.verticalCenter: parent.verticalCenter
                text: "Latest value"
                font.family: Theme.fontFamily; font.pixelSize: 13; color: Theme.semantic.textSubtle
            }
            Text {
                anchors.verticalCenter: parent.verticalCenter
                width: 36
                text: feed.hasData ? feed.formatValue(feed.valueAt(feed.series.length - 1), feed.series.length - 1) : "—"
                font.family: Theme.monoFontFamily; font.pixelSize: 16; font.weight: Font.Medium
                color: Theme.semantic.textDefault
            }
            SySparklineChart {
                id: feed
                width: 160; height: 40
                type: storyArgs.type; values: story.seed()
                stream: storyArgs.stream; animated: storyArgs.animated; streamDuration: storyArgs.streamDuration
                smooth: storyArgs.smooth; showPoints: storyArgs.showPoints; showValue: storyArgs.showValue
                fontColor: Theme.semantic.textDefault
                stockColorScheme: storyArgs.stockColorScheme
            }
        }
        Row {
            spacing: 8
            SyButton { objectName: "sparkline-stream-toggle"; size: "small"; text: story.playing ? "Pause" : "Play"; variant: "primary"; onClicked: story.playing = !story.playing }
            SyButton { objectName: "sparkline-stream-push"; size: "small"; text: "Push one value"; onClicked: story.pushValue() }
            SyButton { objectName: "sparkline-stream-reset"; size: "small"; text: "Reset"; onClicked: story.resetFeed() }
        }
        Text {
            visible: "" !== "stream"
            text: ("Feed: %1 ms   Maximum: %2 ms   Last transition: %3 ms").arg(storyArgs.timeInterval).arg(storyArgs.streamDuration).arg(feed.lastStreamAddTime < 0 ? "—" : !storyArgs.animated || Theme.reducedMotion ? "0" : String(feed.transitionDuration))
            font.family: Theme.monoFontFamily; font.pixelSize: 12; color: Theme.semantic.textSubtle
        }
        Text {
            text: ("Values: %1 / %2   Pushed: %3").arg(feed.series.length).arg(feed.streamCap).arg(story.tick)
            font.family: Theme.monoFontFamily; font.pixelSize: 12; color: Theme.semantic.textSubtle
        }
    }
}

04 pointFocused · pointSelected · valueAdded · valueUpdated · valueRemoved

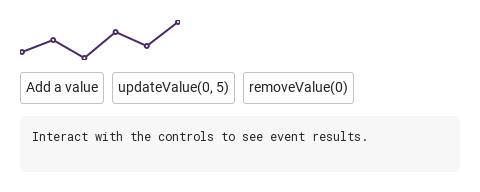
Hover, click or use arrow keys / Home / End to inspect points.

Qt capture · image
pointFocused · pointSelected · valueAdded · valueUpdated · valueRemoved · Default
QML code
import QtQuick
import Syidax.Core

Item {
    component EventLog: Rectangle {
        id: logBox
        property var lines: []
        implicitWidth: 440
        implicitHeight: Math.max(56, logText.implicitHeight + 24)
        radius: 4; color: Theme.semantic.backgroundBold
        function log(value) { lines = lines.slice(-3).concat([String(value)]) }
        Text {
            id: logText; x: 12; y: 12; width: parent.width - 24
            text: logBox.lines.length ? logBox.lines.join("\n") : "Interact with the controls to see event results."
            wrapMode: Text.Wrap; color: Theme.semantic.textDefault
            font.family: Theme.monoFontFamily; font.pixelSize: 12
        }
    }

    implicitWidth: Math.max(360, childrenRect.width)
    implicitHeight: childrenRect.height
    // Focused Gallery routes: keep only the selected API and its prerequisites.

    id: story


    Column {
        spacing: 12
        Item {
            width: 160
            height: 56
            SySparklineChart {
                id: trend
                y: 16
                width: 160; height: 40
                showPoints: true
                values: [12, 18, 9, 22, 15, 27]
                onPointFocused: (detail) => { if (true) { output.log(("pointFocused: %1 = %2").arg(detail.index).arg(detail.value)) } }
                onPointSelected: (detail) => { if (true) { output.log(("pointSelected: %1 = %2").arg(detail.index).arg(detail.value)) } }
                onValueAdded: (detail) => { if (true) { output.log(("valueAdded: %1").arg(detail.value)) } }
                onValueUpdated: (detail) => { if (true) { output.log("valueUpdated: " + JSON.stringify(detail)) } }
                onValueRemoved: (detail) => { if (true) { output.log("valueRemoved: " + JSON.stringify(detail)) } }
            }
        }
        Row {
            spacing: 8
            SyButton { id: exampleControl1;  visible: true; text: "Add a value"; onClicked: trend.addValue(Math.round(Math.random() * 30)) }
            SyButton { id: exampleControl2;  visible: true; text: "updateValue(0, 5)"; onClicked: trend.updateValue(0, 5) }
            SyButton { id: exampleControl3;  visible: true; text: "removeValue(0)"; onClicked: trend.removeValue(0) }
        }
        EventLog { id: output }
    }
}

05 addValue · updateValue · removeValue · setActiveIndex · getValues · setStockColorScheme

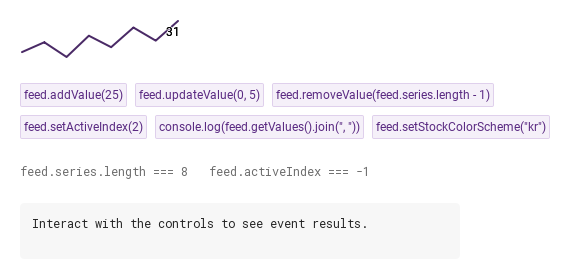
- addValue(value) appends a number or OHLC candle and emits valueAdded.

Qt capture · image
addValue · updateValue · removeValue · setActiveIndex · getValues · setStockColorScheme · Default
QML code
import QtQuick
import Syidax.Core

Item {
    component EventLog: Rectangle {
        id: logBox
        property var lines: []
        implicitWidth: 440
        implicitHeight: Math.max(56, logText.implicitHeight + 24)
        radius: 4; color: Theme.semantic.backgroundBold
        function log(value) { lines = lines.slice(-3).concat([String(value)]) }
        Text {
            id: logText; x: 12; y: 12; width: parent.width - 24
            text: logBox.lines.length ? logBox.lines.join("\n") : "Interact with the controls to see event results."
            wrapMode: Text.Wrap; color: Theme.semantic.textDefault
            font.family: Theme.monoFontFamily; font.pixelSize: 12
        }
    }

    implicitWidth: Math.max(360, childrenRect.width)
    implicitHeight: childrenRect.height
    // Focused Gallery routes: keep only the selected API and its prerequisites.
    id: featureStory

    readonly property bool stockExample: "" === "setStockColorScheme"
    readonly property var exampleValues: stockExample ? [[10,14,9,13],[13,15,11,12],[12,16,12,15],[15,15,10,11]] : [12,18,9,22,15,27,19,31]

    Column {
        spacing: 24
        Item {
            width: 160
            height: 56
            SySparklineChart { id: feed; y: 16; width: 160; height: 40; stream: true; showValue: true; type: featureStory.stockExample ? "stock" : "line"; values: featureStory.exampleValues }
        }
        Flow {
            width: 560
            spacing: 8
            SyButton { id: exampleControl1;  visible: true; text: "feed.addValue(25)"; variant: "secondary"; size: "small"; onClicked: feed.addValue(25) }
            SyButton { id: exampleControl2;  visible: true; text: "feed.updateValue(0, 5)"; variant: "secondary"; size: "small"; onClicked: feed.updateValue(0, 5) }
            SyButton { id: exampleControl3;  visible: true; text: "feed.removeValue(feed.series.length - 1)"; variant: "secondary"; size: "small"; onClicked: feed.removeValue(feed.series.length - 1) }
            SyButton { visible: true; text: "feed.setActiveIndex(2)"; variant: "secondary"; size: "small"; onClicked: feed.setActiveIndex(2) }
            SyButton { visible: true; text: "console.log(feed.getValues().join(\", \"))"; variant: "secondary"; size: "small"; onClicked: output.log(feed.getValues().join(", ")) }
            SyButton { visible: true; text: "feed.setStockColorScheme(\"kr\")"; variant: "secondary"; size: "small"; onClicked: { feed.setStockColorScheme("kr"); output.log("stockColorScheme: " + feed.stockColorScheme) } }
        }
        Text {
            text: "feed.series.length === " + feed.series.length + "   feed.activeIndex === " + feed.activeIndex
            font.family: Theme.monoFontFamily
            font.pixelSize: 12
            color: Theme.semantic.textSubtle
        }
        EventLog { id: output }
    }
}

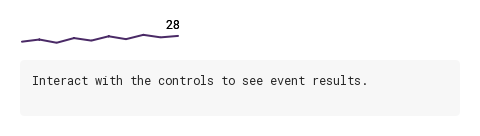
06 Column sparkline

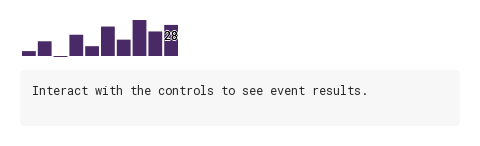
Column sparkline, configured with type, showValue.

Qt capture · image
Column sparkline · Result
Default execution
QML code
import QtQuick
import Syidax.Core

Item {
    component EventLog: Rectangle {
        id: logBox
        property var lines: []
        implicitWidth: 440
        implicitHeight: Math.max(56, logText.implicitHeight + 24)
        radius: 4; color: Theme.semantic.backgroundBold
        function log(value) { lines = lines.slice(-3).concat([String(value)]) }
        Text {
            id: logText; x: 12; y: 12; width: parent.width - 24
            text: logBox.lines.length ? logBox.lines.join("\n") : "Interact with the controls to see event results."
            wrapMode: Text.Wrap; color: Theme.semantic.textDefault
            font.family: Theme.monoFontFamily; font.pixelSize: 12
        }
    }

    implicitWidth: Math.max(360, childrenRect.width)
    implicitHeight: childrenRect.height
    id: story

    readonly property alias chartControl: trend
    property int tick: 0
    readonly property var numbers: [12, 18, 9, 22, 15, 27, 19, 31, 24, 28]
    readonly property var candles: [[10, 14, 9, 13], [13, 15, 11, 12], [12, 16, 12, 15], [15, 15, 10, 11], [11, 14, 10, 14], [14, 18, 13, 17]]
    property QtObject settings: QtObject {
        id: storyArgs
        property string type: "column"
        property string values: ""
        property int width: 160
        property int height: 40
        property string min: ""
        property string max: ""
        property bool smooth: false
        property bool showPoints: false
        property bool showValue: true
        property string textPosition: "top"
        property bool interactive: true
        property string label: "Sparkline chart"
        property string emptyText: "No data"
        property string formatter: "default"
        property string color: ""
        property string fontColor: "#000000"
        property string fontSize: ""
        property string referenceLine: ""
        property real thickness: 2
        property string stockColorScheme: "us"
        property bool stream: false
        property bool animated: true
        property int streamDuration: 1000
        property bool showTooltip: true
    }

    function initialValues() { return storyArgs.values.length ? storyArgs.values : (storyArgs.type === "stock" ? story.candles : story.numbers) }

    function pushValue() {
        story.tick += 1
        const next = Math.round(22 + Math.sin(story.tick * 0.7) * 10)
        if (storyArgs.type === "stock") {
            const current = trend.getValues()
            const open = current.length ? current[current.length - 1].close : 20
            trend.addValue({ open: open, high: Math.max(open, next) + 2, low: Math.min(open, next) - 2, close: next })
        } else trend.addValue(next)
    }

    Connections {
        target: storyArgs

        
    }
    Timer { interval: 500; running: storyArgs.stream; repeat: true; onTriggered: story.pushValue() }
    Column {
        spacing: 12
        Item {
            width: trend.width; height: trend.height + 28
            SySparklineChart {
                id: trend
                y: 28
                width: Math.max(20, storyArgs.width); height: Math.max(20, storyArgs.height)
                type: storyArgs.type
                min: storyArgs.min.trim().length ? Number(storyArgs.min) : Number.NaN
                max: storyArgs.max.trim().length ? Number(storyArgs.max) : Number.NaN
                smooth: storyArgs.smooth; showPoints: storyArgs.showPoints; showValue: storyArgs.showValue
                textPosition: storyArgs.textPosition; interactive: storyArgs.interactive
                label: storyArgs.label; emptyText: storyArgs.emptyText
                formatter: storyArgs.formatter === "default" ? null : (value) => storyArgs.formatter === "fixed2" ? value.toFixed(2) : value.toFixed(1) + "%"
                color: storyArgs.color; fontColor: storyArgs.fontColor; fontSize: storyArgs.fontSize
                referenceLine: storyArgs.referenceLine; thickness: storyArgs.thickness
                stockColorScheme: storyArgs.stockColorScheme
                stream: storyArgs.stream; animated: storyArgs.animated; streamDuration: storyArgs.streamDuration
                showTooltip: storyArgs.showTooltip
                values: story.initialValues()
                onPointSelected: (detail) => output.log(detail.value)
            }
        }
        EventLog { id: output }
    }

}

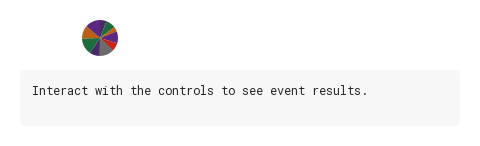
07 Pie sparkline

Pie sparkline, configured with type.

Qt capture · image
Pie sparkline · Result
Default execution
QML code
import QtQuick
import Syidax.Core

Item {
    component EventLog: Rectangle {
        id: logBox
        property var lines: []
        implicitWidth: 440
        implicitHeight: Math.max(56, logText.implicitHeight + 24)
        radius: 4; color: Theme.semantic.backgroundBold
        function log(value) { lines = lines.slice(-3).concat([String(value)]) }
        Text {
            id: logText; x: 12; y: 12; width: parent.width - 24
            text: logBox.lines.length ? logBox.lines.join("\n") : "Interact with the controls to see event results."
            wrapMode: Text.Wrap; color: Theme.semantic.textDefault
            font.family: Theme.monoFontFamily; font.pixelSize: 12
        }
    }

    implicitWidth: Math.max(360, childrenRect.width)
    implicitHeight: childrenRect.height
    id: story

    readonly property alias chartControl: trend
    property int tick: 0
    readonly property var numbers: [12, 18, 9, 22, 15, 27, 19, 31, 24, 28]
    readonly property var candles: [[10, 14, 9, 13], [13, 15, 11, 12], [12, 16, 12, 15], [15, 15, 10, 11], [11, 14, 10, 14], [14, 18, 13, 17]]
    property QtObject settings: QtObject {
        id: storyArgs
        property string type: "pie"
        property string values: ""
        property int width: 160
        property int height: 40
        property string min: ""
        property string max: ""
        property bool smooth: false
        property bool showPoints: false
        property bool showValue: false
        property string textPosition: "top"
        property bool interactive: true
        property string label: "Sparkline chart"
        property string emptyText: "No data"
        property string formatter: "default"
        property string color: ""
        property string fontColor: "#000000"
        property string fontSize: ""
        property string referenceLine: ""
        property real thickness: 2
        property string stockColorScheme: "us"
        property bool stream: false
        property bool animated: true
        property int streamDuration: 1000
        property bool showTooltip: true
    }

    function initialValues() { return storyArgs.values.length ? storyArgs.values : (storyArgs.type === "stock" ? story.candles : story.numbers) }

    function pushValue() {
        story.tick += 1
        const next = Math.round(22 + Math.sin(story.tick * 0.7) * 10)
        if (storyArgs.type === "stock") {
            const current = trend.getValues()
            const open = current.length ? current[current.length - 1].close : 20
            trend.addValue({ open: open, high: Math.max(open, next) + 2, low: Math.min(open, next) - 2, close: next })
        } else trend.addValue(next)
    }

    Connections {
        target: storyArgs

        
    }
    Timer { interval: 500; running: storyArgs.stream; repeat: true; onTriggered: story.pushValue() }
    Column {
        spacing: 12
        Item {
            width: trend.width; height: trend.height + 28
            SySparklineChart {
                id: trend
                y: 28
                width: Math.max(20, storyArgs.width); height: Math.max(20, storyArgs.height)
                type: storyArgs.type
                min: storyArgs.min.trim().length ? Number(storyArgs.min) : Number.NaN
                max: storyArgs.max.trim().length ? Number(storyArgs.max) : Number.NaN
                smooth: storyArgs.smooth; showPoints: storyArgs.showPoints; showValue: storyArgs.showValue
                textPosition: storyArgs.textPosition; interactive: storyArgs.interactive
                label: storyArgs.label; emptyText: storyArgs.emptyText
                formatter: storyArgs.formatter === "default" ? null : (value) => storyArgs.formatter === "fixed2" ? value.toFixed(2) : value.toFixed(1) + "%"
                color: storyArgs.color; fontColor: storyArgs.fontColor; fontSize: storyArgs.fontSize
                referenceLine: storyArgs.referenceLine; thickness: storyArgs.thickness
                stockColorScheme: storyArgs.stockColorScheme
                stream: storyArgs.stream; animated: storyArgs.animated; streamDuration: storyArgs.streamDuration
                showTooltip: storyArgs.showTooltip
                values: story.initialValues()
                onPointSelected: (detail) => output.log(detail.value)
            }
        }
        EventLog { id: output }
    }

}

08 Fixed value range

Fixed value range, configured with min, max, showValue.

Qt capture · image
Fixed value range · Result
Default execution
QML code
import QtQuick
import Syidax.Core

Item {
    component EventLog: Rectangle {
        id: logBox
        property var lines: []
        implicitWidth: 440
        implicitHeight: Math.max(56, logText.implicitHeight + 24)
        radius: 4; color: Theme.semantic.backgroundBold
        function log(value) { lines = lines.slice(-3).concat([String(value)]) }
        Text {
            id: logText; x: 12; y: 12; width: parent.width - 24
            text: logBox.lines.length ? logBox.lines.join("\n") : "Interact with the controls to see event results."
            wrapMode: Text.Wrap; color: Theme.semantic.textDefault
            font.family: Theme.monoFontFamily; font.pixelSize: 12
        }
    }

    implicitWidth: Math.max(360, childrenRect.width)
    implicitHeight: childrenRect.height
    id: story

    readonly property alias chartControl: trend
    property int tick: 0
    readonly property var numbers: [12, 18, 9, 22, 15, 27, 19, 31, 24, 28]
    readonly property var candles: [[10, 14, 9, 13], [13, 15, 11, 12], [12, 16, 12, 15], [15, 15, 10, 11], [11, 14, 10, 14], [14, 18, 13, 17]]
    property QtObject settings: QtObject {
        id: storyArgs
        property string type: "line"
        property string values: ""
        property int width: 160
        property int height: 40
        property string min: "0"
        property string max: "100"
        property bool smooth: false
        property bool showPoints: false
        property bool showValue: true
        property string textPosition: "top"
        property bool interactive: true
        property string label: "Sparkline chart"
        property string emptyText: "No data"
        property string formatter: "default"
        property string color: ""
        property string fontColor: "#000000"
        property string fontSize: ""
        property string referenceLine: ""
        property real thickness: 2
        property string stockColorScheme: "us"
        property bool stream: false
        property bool animated: true
        property int streamDuration: 1000
        property bool showTooltip: true
    }

    function initialValues() { return storyArgs.values.length ? storyArgs.values : (storyArgs.type === "stock" ? story.candles : story.numbers) }

    function pushValue() {
        story.tick += 1
        const next = Math.round(22 + Math.sin(story.tick * 0.7) * 10)
        if (storyArgs.type === "stock") {
            const current = trend.getValues()
            const open = current.length ? current[current.length - 1].close : 20
            trend.addValue({ open: open, high: Math.max(open, next) + 2, low: Math.min(open, next) - 2, close: next })
        } else trend.addValue(next)
    }

    Connections {
        target: storyArgs

        
    }
    Timer { interval: 500; running: storyArgs.stream; repeat: true; onTriggered: story.pushValue() }
    Column {
        spacing: 12
        Item {
            width: trend.width; height: trend.height + 28
            SySparklineChart {
                id: trend
                y: 28
                width: Math.max(20, storyArgs.width); height: Math.max(20, storyArgs.height)
                type: storyArgs.type
                min: storyArgs.min.trim().length ? Number(storyArgs.min) : Number.NaN
                max: storyArgs.max.trim().length ? Number(storyArgs.max) : Number.NaN
                smooth: storyArgs.smooth; showPoints: storyArgs.showPoints; showValue: storyArgs.showValue
                textPosition: storyArgs.textPosition; interactive: storyArgs.interactive
                label: storyArgs.label; emptyText: storyArgs.emptyText
                formatter: storyArgs.formatter === "default" ? null : (value) => storyArgs.formatter === "fixed2" ? value.toFixed(2) : value.toFixed(1) + "%"
                color: storyArgs.color; fontColor: storyArgs.fontColor; fontSize: storyArgs.fontSize
                referenceLine: storyArgs.referenceLine; thickness: storyArgs.thickness
                stockColorScheme: storyArgs.stockColorScheme
                stream: storyArgs.stream; animated: storyArgs.animated; streamDuration: storyArgs.streamDuration
                showTooltip: storyArgs.showTooltip
                values: story.initialValues()
                onPointSelected: (detail) => output.log(detail.value)
            }
        }
        EventLog { id: output }
    }

}

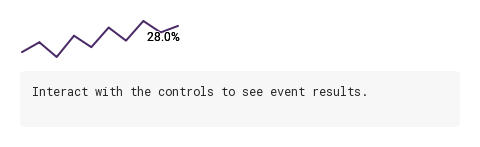
09 Formatted values

Formatted values, configured with formatter, showValue.

Qt capture · image
Formatted values · Result
Default execution
QML code
import QtQuick
import Syidax.Core

Item {
    component EventLog: Rectangle {
        id: logBox
        property var lines: []
        implicitWidth: 440
        implicitHeight: Math.max(56, logText.implicitHeight + 24)
        radius: 4; color: Theme.semantic.backgroundBold
        function log(value) { lines = lines.slice(-3).concat([String(value)]) }
        Text {
            id: logText; x: 12; y: 12; width: parent.width - 24
            text: logBox.lines.length ? logBox.lines.join("\n") : "Interact with the controls to see event results."
            wrapMode: Text.Wrap; color: Theme.semantic.textDefault
            font.family: Theme.monoFontFamily; font.pixelSize: 12
        }
    }

    implicitWidth: Math.max(360, childrenRect.width)
    implicitHeight: childrenRect.height
    id: story

    readonly property alias chartControl: trend
    property int tick: 0
    readonly property var numbers: [12, 18, 9, 22, 15, 27, 19, 31, 24, 28]
    readonly property var candles: [[10, 14, 9, 13], [13, 15, 11, 12], [12, 16, 12, 15], [15, 15, 10, 11], [11, 14, 10, 14], [14, 18, 13, 17]]
    property QtObject settings: QtObject {
        id: storyArgs
        property string type: "line"
        property string values: ""
        property int width: 160
        property int height: 40
        property string min: ""
        property string max: ""
        property bool smooth: false
        property bool showPoints: false
        property bool showValue: true
        property string textPosition: "top"
        property bool interactive: true
        property string label: "Sparkline chart"
        property string emptyText: "No data"
        property string formatter: "percent"
        property string color: ""
        property string fontColor: "#000000"
        property string fontSize: ""
        property string referenceLine: ""
        property real thickness: 2
        property string stockColorScheme: "us"
        property bool stream: false
        property bool animated: true
        property int streamDuration: 1000
        property bool showTooltip: true
    }

    function initialValues() { return storyArgs.values.length ? storyArgs.values : (storyArgs.type === "stock" ? story.candles : story.numbers) }

    function pushValue() {
        story.tick += 1
        const next = Math.round(22 + Math.sin(story.tick * 0.7) * 10)
        if (storyArgs.type === "stock") {
            const current = trend.getValues()
            const open = current.length ? current[current.length - 1].close : 20
            trend.addValue({ open: open, high: Math.max(open, next) + 2, low: Math.min(open, next) - 2, close: next })
        } else trend.addValue(next)
    }

    Connections {
        target: storyArgs

        
    }
    Timer { interval: 500; running: storyArgs.stream; repeat: true; onTriggered: story.pushValue() }
    Column {
        spacing: 12
        Item {
            width: trend.width; height: trend.height + 28
            SySparklineChart {
                id: trend
                y: 28
                width: Math.max(20, storyArgs.width); height: Math.max(20, storyArgs.height)
                type: storyArgs.type
                min: storyArgs.min.trim().length ? Number(storyArgs.min) : Number.NaN
                max: storyArgs.max.trim().length ? Number(storyArgs.max) : Number.NaN
                smooth: storyArgs.smooth; showPoints: storyArgs.showPoints; showValue: storyArgs.showValue
                textPosition: storyArgs.textPosition; interactive: storyArgs.interactive
                label: storyArgs.label; emptyText: storyArgs.emptyText
                formatter: storyArgs.formatter === "default" ? null : (value) => storyArgs.formatter === "fixed2" ? value.toFixed(2) : value.toFixed(1) + "%"
                color: storyArgs.color; fontColor: storyArgs.fontColor; fontSize: storyArgs.fontSize
                referenceLine: storyArgs.referenceLine; thickness: storyArgs.thickness
                stockColorScheme: storyArgs.stockColorScheme
                stream: storyArgs.stream; animated: storyArgs.animated; streamDuration: storyArgs.streamDuration
                showTooltip: storyArgs.showTooltip
                values: story.initialValues()
                onPointSelected: (detail) => output.log(detail.value)
            }
        }
        EventLog { id: output }
    }

}

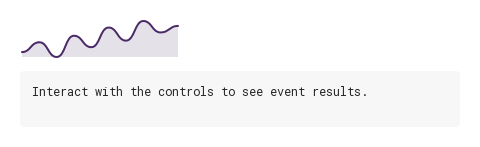
10 Filled area

Filled area, configured with type, smooth.

Qt capture · image
Filled area · Result
Default execution
QML code
import QtQuick
import Syidax.Core

Item {
    component EventLog: Rectangle {
        id: logBox
        property var lines: []
        implicitWidth: 440
        implicitHeight: Math.max(56, logText.implicitHeight + 24)
        radius: 4; color: Theme.semantic.backgroundBold
        function log(value) { lines = lines.slice(-3).concat([String(value)]) }
        Text {
            id: logText; x: 12; y: 12; width: parent.width - 24
            text: logBox.lines.length ? logBox.lines.join("\n") : "Interact with the controls to see event results."
            wrapMode: Text.Wrap; color: Theme.semantic.textDefault
            font.family: Theme.monoFontFamily; font.pixelSize: 12
        }
    }

    implicitWidth: Math.max(360, childrenRect.width)
    implicitHeight: childrenRect.height
    id: story

    readonly property alias chartControl: trend
    property int tick: 0
    readonly property var numbers: [12, 18, 9, 22, 15, 27, 19, 31, 24, 28]
    readonly property var candles: [[10, 14, 9, 13], [13, 15, 11, 12], [12, 16, 12, 15], [15, 15, 10, 11], [11, 14, 10, 14], [14, 18, 13, 17]]
    property QtObject settings: QtObject {
        id: storyArgs
        property string type: "area"
        property string values: ""
        property int width: 160
        property int height: 40
        property string min: ""
        property string max: ""
        property bool smooth: true
        property bool showPoints: false
        property bool showValue: false
        property string textPosition: "top"
        property bool interactive: true
        property string label: "Sparkline chart"
        property string emptyText: "No data"
        property string formatter: "default"
        property string color: ""
        property string fontColor: "#000000"
        property string fontSize: ""
        property string referenceLine: ""
        property real thickness: 2
        property string stockColorScheme: "us"
        property bool stream: false
        property bool animated: true
        property int streamDuration: 1000
        property bool showTooltip: true
    }

    function initialValues() { return storyArgs.values.length ? storyArgs.values : (storyArgs.type === "stock" ? story.candles : story.numbers) }

    function pushValue() {
        story.tick += 1
        const next = Math.round(22 + Math.sin(story.tick * 0.7) * 10)
        if (storyArgs.type === "stock") {
            const current = trend.getValues()
            const open = current.length ? current[current.length - 1].close : 20
            trend.addValue({ open: open, high: Math.max(open, next) + 2, low: Math.min(open, next) - 2, close: next })
        } else trend.addValue(next)
    }

    Connections {
        target: storyArgs

        
    }
    Timer { interval: 500; running: storyArgs.stream; repeat: true; onTriggered: story.pushValue() }
    Column {
        spacing: 12
        Item {
            width: trend.width; height: trend.height + 28
            SySparklineChart {
                id: trend
                y: 28
                width: Math.max(20, storyArgs.width); height: Math.max(20, storyArgs.height)
                type: storyArgs.type
                min: storyArgs.min.trim().length ? Number(storyArgs.min) : Number.NaN
                max: storyArgs.max.trim().length ? Number(storyArgs.max) : Number.NaN
                smooth: storyArgs.smooth; showPoints: storyArgs.showPoints; showValue: storyArgs.showValue
                textPosition: storyArgs.textPosition; interactive: storyArgs.interactive
                label: storyArgs.label; emptyText: storyArgs.emptyText
                formatter: storyArgs.formatter === "default" ? null : (value) => storyArgs.formatter === "fixed2" ? value.toFixed(2) : value.toFixed(1) + "%"
                color: storyArgs.color; fontColor: storyArgs.fontColor; fontSize: storyArgs.fontSize
                referenceLine: storyArgs.referenceLine; thickness: storyArgs.thickness
                stockColorScheme: storyArgs.stockColorScheme
                stream: storyArgs.stream; animated: storyArgs.animated; streamDuration: storyArgs.streamDuration
                showTooltip: storyArgs.showTooltip
                values: story.initialValues()
                onPointSelected: (detail) => output.log(detail.value)
            }
        }
        EventLog { id: output }
    }

}

API 76

Hover or select an item for its QML example and copy button.

Properties

PropertyTypeDefaultDescription
var[]The data: an array, a "1, 2, 3" string or a JSON string; for stock candles as { open, high, low, close } or [o, h, l, c]. Replaced by the parsed array after a method call.
string"line""line" · "area" · "column" · "pie" · "stock".
realNaNPin the vertical range (NaN = from the data). Not for pie.
boolfalseSmooth line/area; curved is the compatibility alias.
boolfalseA dot at every point; off = only the active point (and a lone single point).
boolfalseThe label of the active (else last) point.
string"top""top" (falls back to below when there is no room) or "bottom".

string""Label size; numeric/px, pt, em/rem, %. Default 12 px.
string"#000000"Label colour.
var (function)null(value, index) => string for the label and the tooltip.
string""The series colour ("" = Theme.semantic.borderBrandBold).
real2Stroke width and dot radius.
string""A number as text: dashed rule, above / below colours, column and area base.
string"us""us" (up green, down red) or "kr" (up red, down blue).
booltrueHover, click, keys and the tooltip.
booltrueThe floating value above the chart while a point is active.
int-1The highlighted point; -1 = none. Assigning it draws without a signal.
boolfalseaddValue keeps a rolling window of streamCap entries.
int10Capacity initialized from the first stream values (10 if empty), then retained. QML extension.
string"No data"Shown when the series is empty.
booltruefalse skips the morph between data states — the values jump.
int1000The morph duration in ms while stream is on (otherwise the quick 100 ms transition).
string"Sparkline chart"The chart's accessible name (Accessible.name).
var (read-only)—The parsed numbers or candles.
bool (read-only)—Series non-empty · type === "stock" · a valid referenceLine.
real (read-only)—The parsed reference value (NaN when none).
var (read-only)—The computed { points, rects, candles, slices, baselineY } in item coordinates.
color (read-only)—The resolved colours.

Additional properties

NameType / defaultDescription
real (px) · 160Logical width of the inline sparkline. Change it while keeping height at 40 to compare horizontal density; no axes are added.
real (px) · 40Logical height of the inline sparkline. Change it while keeping width at 160; the data domain is mapped into the available height.

Methods

MethodDescription
Parses and appends one entry, trims to streamCap when stream is on, emits valueAdded. Invalid input is ignored.
Replaces the entry at index; emits valueUpdated. Ignored when out of range or invalid.
Removes the entry, keeps activeIndex in range, emits valueRemoved. Ignored when out of range.
Rounds/clamps the index and emits pointFocused on change. Set activeIndex = -1 to clear.
Sets activeIndex and emits pointFocused (what hover and the keys call).
Returns an independent array; stock objects are copied too.
Sets stockColorScheme.
The number at an index (candle → close)
the formatted text
the parser used for values.

Signals

SignalArgumentsWhen
detail: { index, value }A new point/slice is focused by pointer, keyboard or setActiveIndex.
detail: { index, value }A click on the chart, or Return / Space with an active point. Not when interactive is off.
detail: { index, value, values }After addValue() with a valid entry.
detail: { index, value, oldValue, values }After updateValue() with a valid index and entry.
detail: { index, value, values }After removeValue() with a valid index.

Signals

ItemBehavior / conditions
Assigning values emits only the property's own valuesChanged / seriesChanged.

Behavior

ItemBehavior / conditions
Shown when the series is empty.
min / max pin the vertical domain; a flat domain widens by ±1.
A number as text: dashed rule, above / below colours, column and area base.
A click on the chart, or Return / Space with an active point. Not when interactive is off.
Rounds/clamps the index and emits pointFocused on change. Set activeIndex = -1 to clear.
A new point/slice is focused by pointer, keyboard or setActiveIndex.
Hover, click, keys and the tooltip.
The floating value above the chart while a point is active.
The label of the active (else last) point.
"top" (falls back to below when there is no room) or "bottom".
Label size; numeric/px, pt, em/rem, %. Default 12 px.
(value, index) => string for the label and the tooltip.
addValue keeps a rolling window of streamCap entries.
Parses and appends one entry, trims to streamCap when stream is on, emits valueAdded. Invalid input is ignored.
false skips the morph between data states — the values jump.
The morph duration in ms while stream is on (otherwise the quick 100 ms transition).
The series colour ("" = Theme.semantic.borderBrandBold).
"us" (up green, down red) or "kr" (up red, down blue).
The chart's accessible name (Accessible.name).

Keyboard

ItemBehavior / conditions
SyProgressBar / SyProgressCircular (a single value instead of a series), SyCard and SyTable (where sparklines usually live).