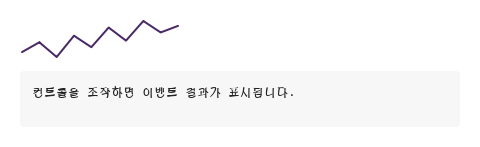
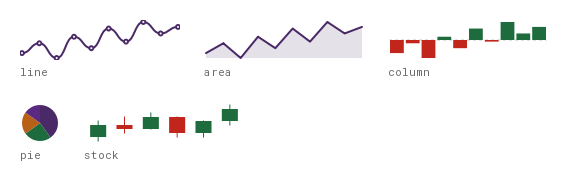
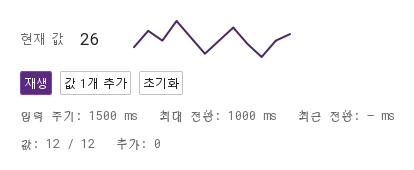
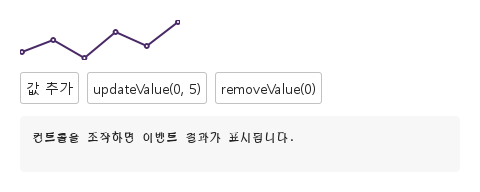
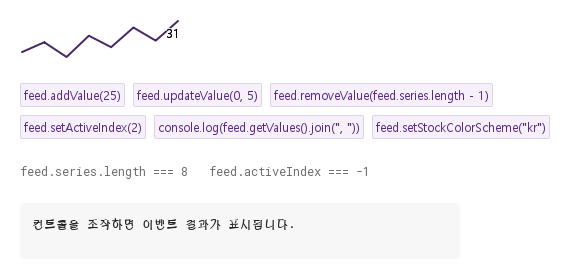
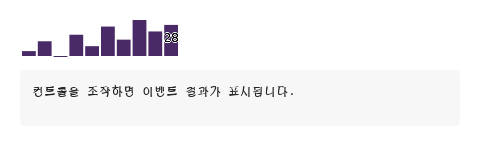
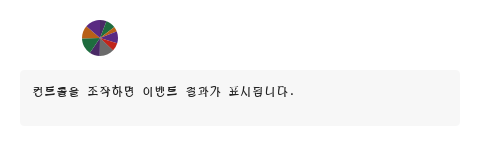
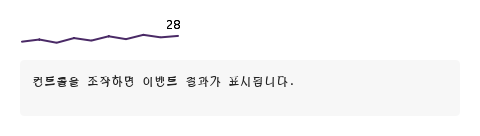
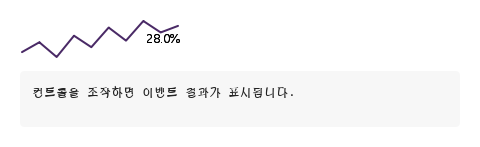
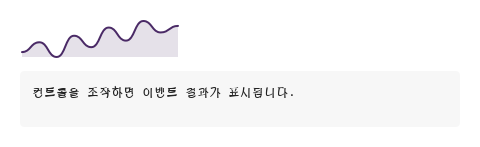
숫자 또는 OHLC 데이터를 표시하는 작은 차트입니다.
QML 코드
import QtQuick
import Syidax.Core

Item {
    component EventLog: Rectangle {
        id: logBox
        property var lines: []
        implicitWidth: 440
        implicitHeight: Math.max(56, logText.implicitHeight + 24)
        radius: 4; color: Theme.semantic.backgroundBold
        function log(value) { lines = lines.slice(-3).concat([String(value)]) }
        Text {
            id: logText; x: 12; y: 12; width: parent.width - 24
            text: logBox.lines.length ? logBox.lines.join("\n") : "컨트롤을 조작하면 이벤트 결과가 표시됩니다."
            wrapMode: Text.Wrap; color: Theme.semantic.textDefault
            font.family: Theme.monoFontFamily; font.pixelSize: 12
        }
    }

    implicitWidth: Math.max(360, childrenRect.width)
    implicitHeight: childrenRect.height
    id: story

    readonly property alias chartControl: trend
    property int tick: 0
    readonly property var numbers: [12, 18, 9, 22, 15, 27, 19, 31, 24, 28]
    readonly property var candles: [[10, 14, 9, 13], [13, 15, 11, 12], [12, 16, 12, 15], [15, 15, 10, 11], [11, 14, 10, 14], [14, 18, 13, 17]]
    property QtObject settings: QtObject {
        id: storyArgs
        property string type: "line"
        property string values: ""
        property int width: 160
        property int height: 40
        property string min: ""
        property string max: ""
        property bool smooth: false
        property bool showPoints: false
        property bool showValue: false
        property string textPosition: "top"
        property bool interactive: true
        property string label: "Sparkline chart"
        property string emptyText: "No data"
        property string formatter: "default"
        property string color: ""
        property string fontColor: "#000000"
        property string fontSize: ""
        property string referenceLine: ""
        property real thickness: 2
        property string stockColorScheme: "us"
        property bool stream: false
        property bool animated: true
        property int streamDuration: 1000
        property bool showTooltip: true
    }

    function initialValues() { return storyArgs.values.length ? storyArgs.values : (storyArgs.type === "stock" ? story.candles : story.numbers) }

    function pushValue() {
        story.tick += 1
        const next = Math.round(22 + Math.sin(story.tick * 0.7) * 10)
        if (storyArgs.type === "stock") {
            const current = trend.getValues()
            const open = current.length ? current[current.length - 1].close : 20
            trend.addValue({ open: open, high: Math.max(open, next) + 2, low: Math.min(open, next) - 2, close: next })
        } else trend.addValue(next)
    }

    Connections {
        target: storyArgs


    }
    Timer { interval: 500; running: storyArgs.stream; repeat: true; onTriggered: story.pushValue() }
    Column {
        spacing: 12
        Item {
            width: trend.width; height: trend.height + 28
            SySparklineChart {
                id: trend
                y: 28
                width: Math.max(20, storyArgs.width); height: Math.max(20, storyArgs.height)
                type: storyArgs.type
                min: storyArgs.min.trim().length ? Number(storyArgs.min) : Number.NaN
                max: storyArgs.max.trim().length ? Number(storyArgs.max) : Number.NaN
                smooth: storyArgs.smooth; showPoints: storyArgs.showPoints; showValue: storyArgs.showValue
                textPosition: storyArgs.textPosition; interactive: storyArgs.interactive
                label: storyArgs.label; emptyText: storyArgs.emptyText
                formatter: storyArgs.formatter === "default" ? null : (value) => storyArgs.formatter === "fixed2" ? value.toFixed(2) : value.toFixed(1) + "%"
                color: storyArgs.color; fontColor: storyArgs.fontColor; fontSize: storyArgs.fontSize
                referenceLine: storyArgs.referenceLine; thickness: storyArgs.thickness
                stockColorScheme: storyArgs.stockColorScheme
                stream: storyArgs.stream; animated: storyArgs.animated; streamDuration: storyArgs.streamDuration
                showTooltip: storyArgs.showTooltip
                values: story.initialValues()
                onPointSelected: (detail) => output.log(detail.value)
            }
        }
        EventLog { id: output }
    }

}